Добрый день, Коллеги. Важное сообщение, просьба принять участие. Музей Ферсмана ищет помощь для реставрационных работ в помещении. Подробности по ссылке
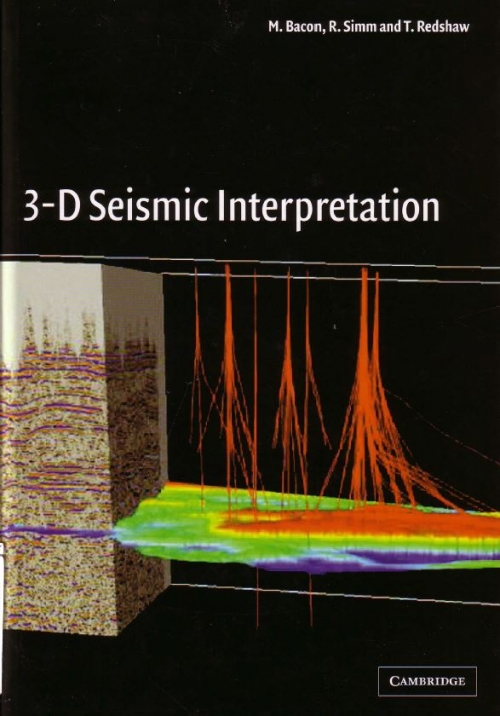
3-D seismic data have become the key tool used in the oil and gas industry to understand the subsurface. In addition to providing excellent structural images, the dense sampling of a 3-D survey can sometimes make it possible to map reservoir quality and the distribution of oil and gas. The aim of this book is to help geophysicists and geologists new to the technique to interpret 3-D data while avoiding common pitfalls.
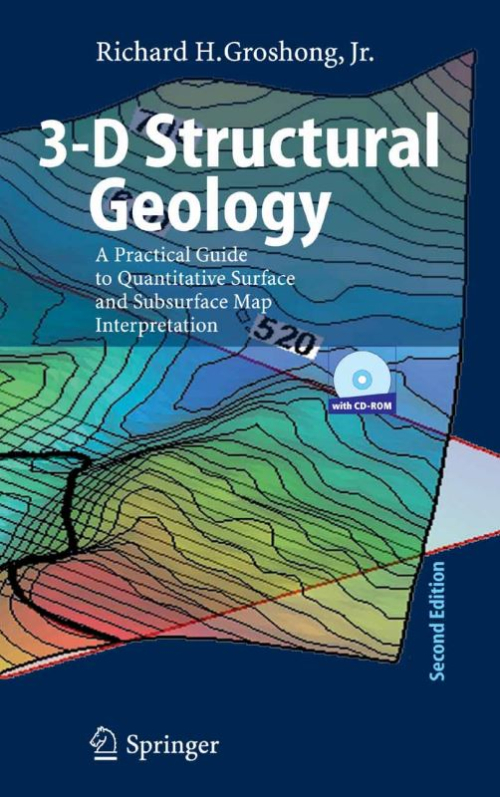
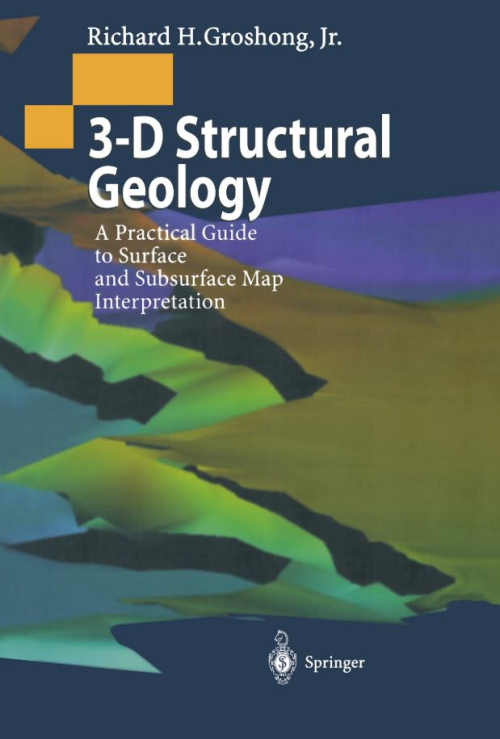
Geological structures are three dimensional, yet are typically represented by, and interpreted from, outcrop maps and structure contour maps, both of which are curved two-dimensional surfaces. Maps plus serial sections, called 2½-D, provide a closer approach to three dimensionality. Computer technology now makes it possible for geological interpretations to be developed from the beginning in a fully three dimensional environment. Fully 3-D geological models allow significantly better interpretations and interpretations that are much easier to share with other geologists and with the general public. This book provides an overview of techniques for constructing structural interpretations in 2-D, 2½-D and 3-D environments; for interpolating between and extrapolating beyond the control points; and for validating the final interpretation. The underlying philosophy is that structures are three-dimensional solid bodies and that data from throughout the structure, whether in 2-D or 3-D format, should be integrated into an internally consistent 3-D interpretation.
Many important decisions, ranging from locating an oil prospect or a land-fill site to determining the location and size of an earthquake-producing fault, are based on geological maps. Because a map-scale structure is never completely sampled in three dimensions, geological maps and the cross sections derived from maps are always interpretations. The interpretation may be complicated by direct structural observations, like bedding attitudes, that are misleading because they represent a local structure, not the map-scale structure.
Geologists as a group have and use above-average spatial thinking skills to interpret and communicate complex geologic structures. Interpretation challenges, especially with petroleum industry subsurface targets, come from abundant but still ambiguous data volumes, challenging geologic forms, powerful but difficult-to-learn software, and under prepared staff. In June 2013, 70 participants met in Reno to discuss these and related issues and to explore how spatial cognitive science can help us better understand and develop geologic interpretation skills, software tools, and education strategies. Industry interpreters and trainers, academic structural geologists, software developers, and cognitive scientists brought complementary perspectives to three days of presentations, posters, and discussions, plus a field day with interactive interpretation modules. This Hedberg conference provided new shared insights to the interpretation process, ideas for improving skill development, and abundant opportunities for further collaboration. <...>
Collecting quantitative data to support geological analysis and modelling is nowadays a fundamental requirement in all geology disciplines, including structural geology, stratigraphy, and geomorphology, on the Earth and on planetary bodies of the Solar System. In many cases the answer to this need is a Digital Outcrop Model (DOM), a Digital Elevation Model (DEM), or a Shape Model (SM): this can be a digital representation of an outcrop or topographic surface, or of a whole small body (asteroid or comet nucleus) for an SM, generally combined with imagery, that can be quantitatively visualized andstudied in 3D, with the goal of obtaining quantitative measurements.
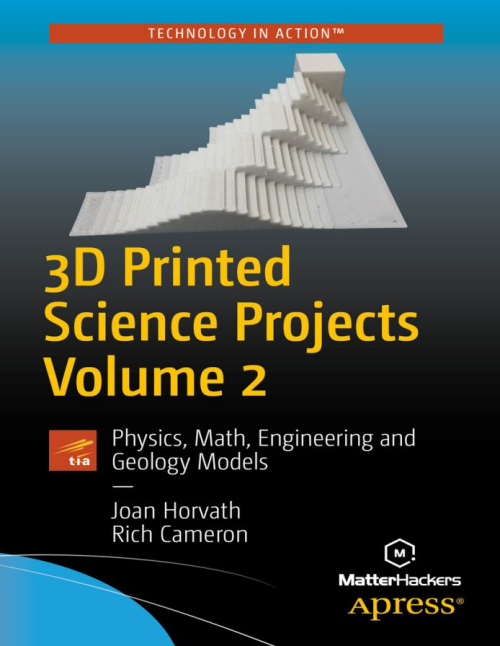
This chapter looks at the deceptively simple world of pendulums. First we cover why pendulums swing back and forth as they do, and tie this into the general idea of simple harmonic motion—a type of oscillatory motion in which a system stores energy (in a spring or by working against gravity) and then uses that stored energy to move back to its original position.
Three-dimensional (3D) seismic data have had a substantial impact on the successful exploration and production of hydrocarbons. Although most commonly acquired by the oil and gas exploration industry, these data are starting to be used as a research tool in other Earth sciences disciplines. However despite some innovative new directions of academic investigation, most of the examples of how 3D seismic data have increased our understanding of the structure and stratigraphy of sedimentary basins come from the industry that acquired these data.
Editorial for Special Issue “3D/4D Geological Modeling for Mineral Exploration”
Xiumei Lv, Wangdong Yang, Xiaoning Liu and Gongwen Wang Applications of Radial Basis Functional Link Networks in the Exploration for Lala Copper Deposits in Sichuan Province, China
Baoyi Zhang, Yongqiang Tong, Jiangfeng Du, Shafqat Hussain, Zhengwen Jiang and Shahzad Ali et al. Three-Dimensional Structural Modeling (3D SM) and Joint Geophysical Characterization (JGC) of Hydrocarbon Reservoir
Zhifei Liu, Ling Zuo, Senmin Xu, Yaqing He, Chunyi Wang and Luofeng Wang et al. 3D Multi-Parameter Geological Modeling and Knowledge Findings for Mo Oxide Orebodies in the Shangfanggou Porphyry–Skarn Mo (–Fe) Deposit, Henan Province, China
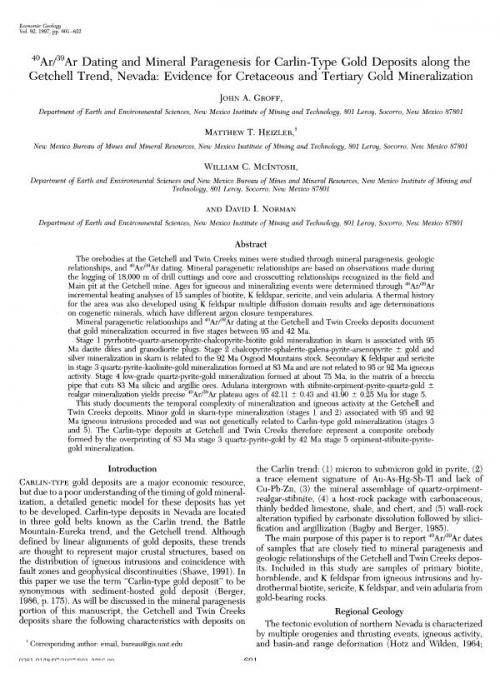
40Ar/39Ar датирование и минеральный парагенезис золоторудных месторождений карлинского типа вдоль Гетчеллского тренда, Невада: свидетельства наличия золоторудной минерализации в меловом и третичном периодах
The orebodies at the Getchell and Twin Creeks mines were studied through mineral paragenesis, geologic relationships, and 40Ar/39Ar dating. Mineral paragenetic relationships are based on observations made during the logging of 18,000 m of drill cuttings and core and crosscutting relationships recognized in the field and Main pit at the Getchell mine. Ages for igneous and mineralizing events were determined through 40Ar/39Ar incremental heating analyses of 15 samples of biotite, K feldspar, sericite, and vein adularia. A thermal history for the area was also developed using K feldspar multiple diffusion domain results and age determinations on cogenetic minerals, which have different argon closure temperatures.