Добрый день, Коллеги. Важное сообщение, просьба принять участие. Музей Ферсмана ищет помощь для реставрационных работ в помещении. Подробности по ссылке
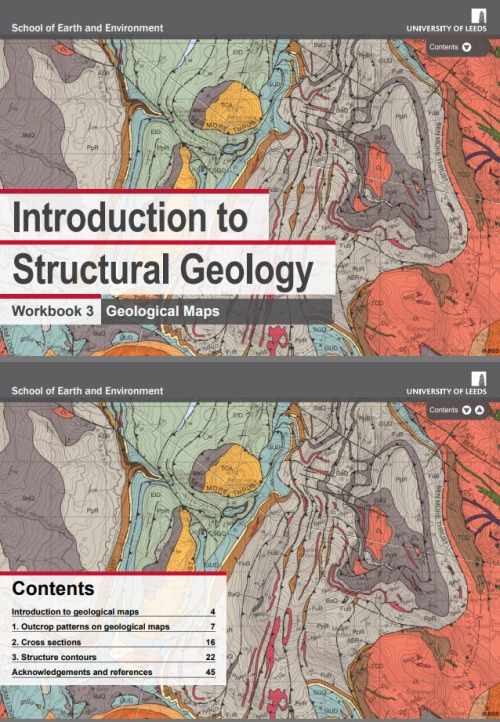
Introduction to structural geology. Workbook 3. Geological maps / Введение в стурктурную геологию. Рабочая тетрадь 3. Геологическая карта
Geological maps represent the solid geology at the Earth’s surface unconcealed by vegetation, soil or buildings (figure 1a). Different rock types and formations are illustrated by different colours and/or symbols. Other features such as faults, mineral veins, coal seams, marker horizons and landslips are shown. Bedding and structural features such as cleavage and foliations are indicated by strike and dip or plunge and azimuth symbols (figure 1b).
There are several different types of geological maps, the main ones being solid geology, which show bedrock, and drift maps, which show unconsolidated sediments such as river alluvium, peat and glacial deposits that lie above bedrock. Geological maps usually include stratigraphic columns and one or more cross section (figure 1c). Stratigraphy columns show the different formations on the map in the order of deposition, with the oldest at the bottom and youngest at the top. They also show their thicknesses and are usually drawn to scale. The cross sections show the sub-surface (and often the above-surface) geology, as predicted from the features mapped at the surface
Maps come in a variety of scales depending on the amount of detail needed for different purposes. In all cases, they will show a grid for location (in Britain, the National Grid on land). Points on the map are referred to using coordinates (eastings then northings) which are usually 6 or 8 figure references. The basic grid square covers 100,000 metres, with northings, for example, given as 670000mN, giving an absolute location in metres. When working within a map, it is usual to give 3 figures (e.g. 700N) or 4 figures (e.g. 7000), depending on the cale of the map. Four figure grid references specify locations to within 10 metres. Maps covering a larger area tend to use latitude and longitude in addition or instead. Maps for other countries will use other National Grids.
This workbook looks first at the outcrop patterns on geological maps, which form due to the interaction of the geology with the topography. At how folds, faults and unconformities form consistent outcrop patterns and the information that can be gained about these structures from a map.
It then looks at how to draw cross sections, including dealing with apparent dip. How to use structure contours to construct cross sections and to use structure contours to make accurate and quantitative predictions about subsurface geology. Working with geological maps enhances the ability to think in 3D and re-enforces the relationships, both temporal and spatial, between different geological units and structures.<...>
У нас есть: 33511 книг, 7894 карты, 47 инбоксов. Итого: 41452 материала
Последнее обновление:
27.07.2026
![]()